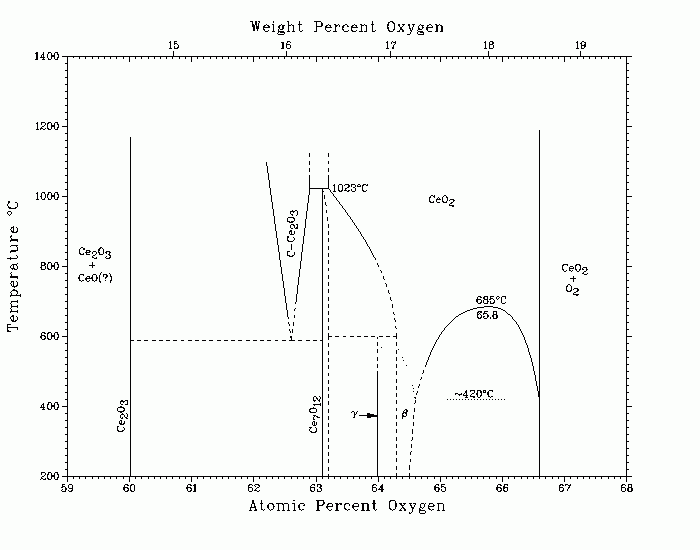
Фазовая диаграмма системы Ce-O
К оглавлению: Другие диаграммы (Others phase diargams)

Ce-O (Cerium-Oxygen) Editor A complete phase diagram for the Ce-O system is unavailable. The partial phase diagram for the region Ce2O3-CeO2 is redrawn from [Shunk], with minor modifications, especially in the region from 64 to 65 at.% O. The region <64 at.% O is based on [64Bev], whereas the miscibility gap in the CeO2 phase field is drawn from [61Bra]. More recent thermogravimetric analysis [76Sor] on cerium oxides with compositions between CeO1.75 and CeO2.00 suggested that in the temperature range 900 to 1400 C, the CeO2 phase field can be subdivided into several subregions, each consisting of a nonstoichiometric ordered intermediate phase.-P.R.S. 47Cro: U. Croatto and M. Bruno, Proc. 11th Int. Cong. Pure Appl. Chem., London, Vol. I, 69-74 (1947). 55Bev: D.J.M. Bevan, J. Inorg. Nucl. Chem., 1, 49-59 (1955). 61Bra: G. Brauer and K. Gingerich in Rare Earth Research, E.V. Kleber, Ed., Macmillan, New York, 96-104 (1961). 64Bev: D.J.M. Bevan and J. Kordis, J. Inorg. Nucl. Chem., 26, 1509-1523 (1964). 64Gsc: K.A. Gschneidner, Jr., and J.T. Waber, J. Less-Common Met., 6, 354-361 ( 1964). 75Ray1: S.P. Ray and D.E. Cox, J. Solid State Chem., 15(4), 333-343 (1975). 75Ray2: S.P. Ray, A.S. Nowick, and D.E. Cox, J. Solid State Chem., 15(4), 344- 351 (1975). 76Sor: O.T. Sorensen, J. Solid State Chem., 18, 217-233 (1976). 79Leg: J.M. Leger, N. Yacoubi, and J. Loriers, Mater. Res. Bull., 14, 1431- 1436 (1979) in French. 82Cel: G. Celotti, G.N. Babini, A. Bellosi, and P. Vincenzini, J. Appl. Crystallogr., 15, 55-59 (1982). 1
